Homelab & networking · Build log
Metrics and logs from the network gear
I onboarded the router, three APs and the HP switch into VictoriaMetrics and Loki in one afternoon, and the switch reboot alert fired the next day.
One afternoon this month, I decided to onboard all my network gear into my existing VictoriaMetrics+Loki stack (which was already monitoring my home server) for metrics and logs, with Grafana dashboards on top and alerts via Pushover. Previously, my OpenWrt boxes and HP switch were only being monitored by Uptime Kuma ping checks, the first of which I’d added that same morning. Sure enough, the following day I got an alert that the switch had unexpectedly rebooted.
I started collecting logs before that, though. The system log on OpenWrt is a ring buffer in RAM, so older entries are lost when it rotates. Back in April, I started sending the router’s logd to rsyslog on my old server via UDP, creating one file per host per date, which made it possible to investigate events after the buffer had rotated. Later I switched logd to send to Grafana Alloy instead via TCP, which pushes to Loki with host and app labels.
I didn’t get it right the first time, though. The default syslog listener format in Alloy is RFC 5424, but OpenWrt’s logd sends the older BSD RFC 3164 format, so every message was rejected until I set the syslog format option to rfc3164. Once that was sorted, I added the same syslog task to the AP role in my Ansible setup, so now all three APs stream logs to Loki alongside the router.
I started small: I wanted SNMP monitoring for the switch and something similar for the router that wouldn’t eat resources. The router has 1 GB RAM, of which ~400 MB was free, and prometheus-node-exporter-lua is in OpenWrt’s 25.x feed, so that seemed like an obvious choice. I installed it with the base collectors and a NAT traffic collector, listening on LAN-only, via a new Ansible task toggled by a variable. My first check-mode dry run failed because the exporter’s uci config didn’t exist until after the package was installed, but that was easy to fix with a probe that’s safe in check mode. Once deployed, the endpoint returned 1,658 lines of metrics.
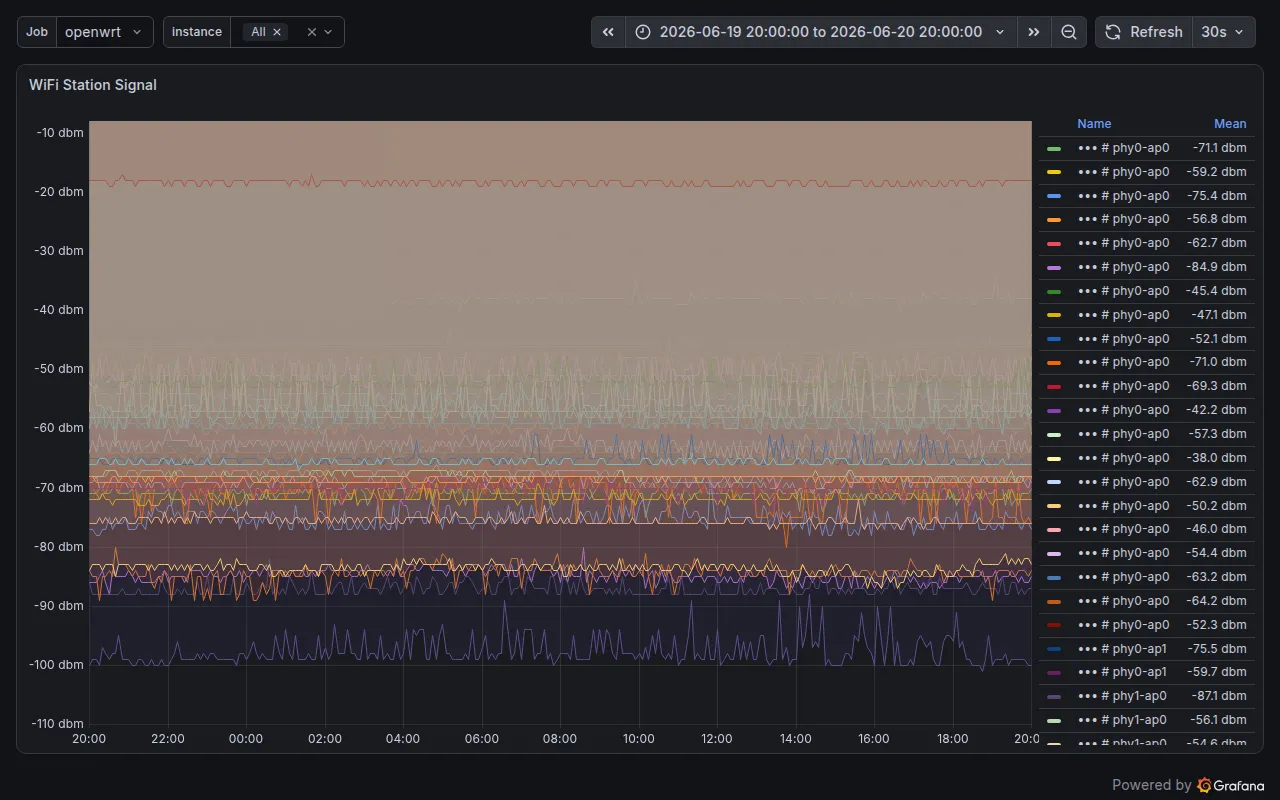
Halfway through the deployment, I realized the APs could export metrics too, so I looked at some community Grafana dashboards for this exporter to see what I was getting into. All three APs now run node-exporter-lua with the wifi and wifi_stations collectors (for per-station signal strength and rate), bringing the total to four OpenWrt devices I’m scraping. I’m using the pull model, so VictoriaMetrics scrapes each exporter directly, and Alloy just logs and traces (which had been the server convention for about a week at that point).
The switch is the odd one out: it’s an HP 1810G-8 running firmware P.2.22. I checked every page in its web UI.. no SNMP settings anywhere. But the SNMP agent answers anyway (v1 and v2c, with a fixed read-only community string, take it or leave it). Fine. Read-only is fine. LAN-only is fine. snmp_exporter v0.29.0 with the stock if_mib and system modules, scraped every 30 seconds by VictoriaMetrics.
Once the data was flowing, I could set up the network-gear alert group to send Pushover messages. First, if the switch becomes SNMP-unreachable for 10 minutes (which would also catch it falling back to its factory IP, which had happened earlier the same day when a power cycle reset the IP and password). Second, if the sysUpTime resets, indicating an unrequested reboot. Third and fourth, the most important switch ports: the router uplink and the living-room AP port. And last but not least, a per-device alert if the exporter goes down for 15 minutes.
One more alert came from the AP logs: since the office AP is on a DFS channel, I set up a Loki rule to match hostapd’s DFS-RADAR-DETECTED and DFS-NEW-CHANNEL lines. The match tokens needed to be anchored, because a loose “cac” also matches “cachesize” in the dnsmasq logs. I checked against seven days of logs and confirmed that there were zero radar events. I’m using Grafana dashboard 11147, which I provision into Grafana as “OpenWrt Fleet”.
I tripped over a few things:
- snmp_exporter’s stock config already defines a
systemmodule. I defined it again in a second config file and the exporter crash-looped on the duplicate key.. two fix-forward commits to sort that out. - The switch-down alert fired while the switch was perfectly healthy.
up == 0returns no series when the target is actually up, and with no-data set to Alerting, that silence turned into a permanent alert. Caught it via Pushover within the hour.. the fix was adding anabsent()check and setting the no-data state to OK. - Dashboard 11147 chains its variables and assumes instance labels in
ip:portform, which mine don’t use. I replaced them with a single instance variable and rewrote 138 label matchers. - The overview panels on that dashboard only work with the exporter’s
openwrtcollector enabled, so I had to add it. - The dashboard is old enough (schemaVersion 19) that its datasource references are plain strings matched by name. Every panel fell back to Loki and sent it PromQL queries.. I converted 68 references to uid objects.
- When only the scrape config changes and the VictoriaMetrics service itself doesn’t, nothing restarts it, so new scrape targets just don’t appear until you send a SIGHUP.
I considered NetFlow, but decided against it: while softflowd on the router itself is light enough, I would need to set up a collector stack on the server, which isn’t worth the added value. I already have nlbwmon running on the router for per-client bandwidth accounting, and node-exporter-lua now covers interface counters.
The next day, the switch reboot alert triggered. The sysUpTime graph shows about 29 hours of uptime and a single reset, taking the server uplink down for about 66 seconds. Unfortunately, the switch’s log lives in RAM and has no clock, so the reboot erased the reason. I configured switch syslog, but it only supports classic BSD syslog over UDP, and the port isn’t changeable, so I set up a second Alloy listener. A packet capture showed no packets when config and web interface events triggered, so I don’t know if it sends anything. The next link event will be the real test. I also added an alert independent of the switch: the carrier-change counter of the server’s own NIC, so I’ll see a flapping link even if the switch stays silent.
The same night, the switch went dark for hours. The server’s metrics revealed the uplink was down for about 6 hours 45 minutes, with 253 continuous local scrapes.. no gaps, so the outage was fully visible even though the switch itself reported nothing. The culprit: power. The switch was running on a passive PoE splitter stepping 48 V down to 12 V, which clearly couldn’t handle the load. The next day, I moved it back to its own 12 V adapter.