Propane from a water heater's gas meter (and a 2.8x correction)
The Navien's gas counter became a propane tracker, but one bad zero turned September into 95 gallons and the tank dial showed the heater is only about a third of the draw.
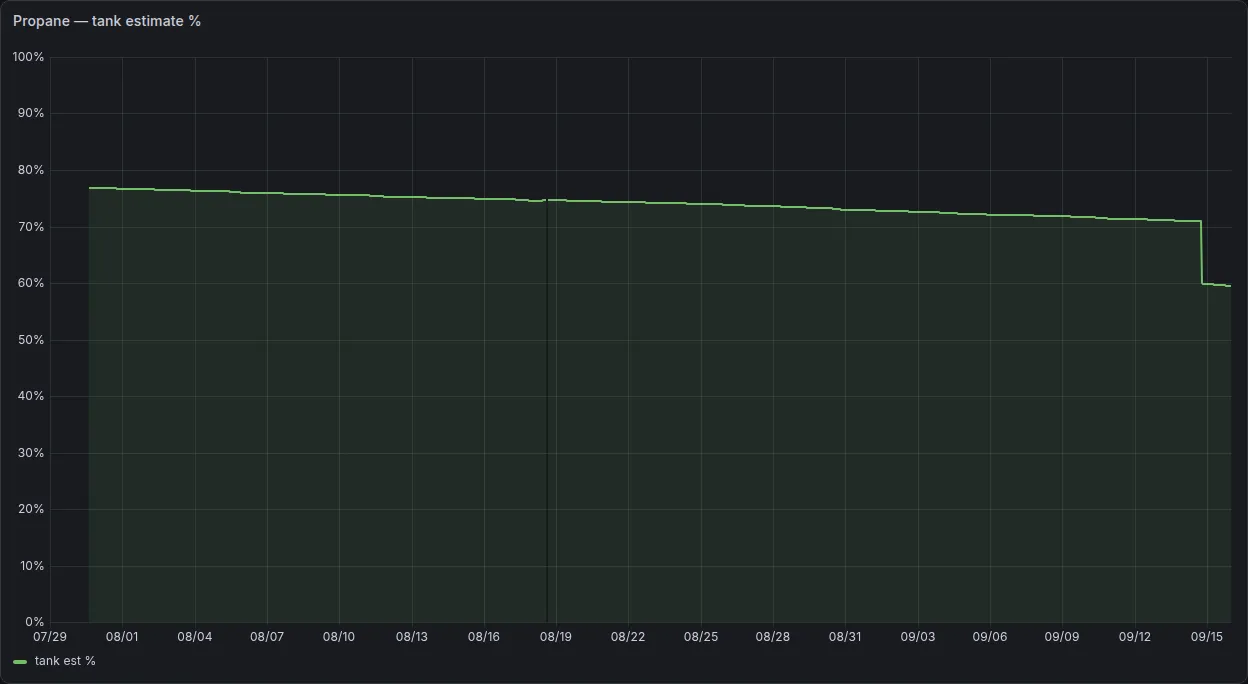
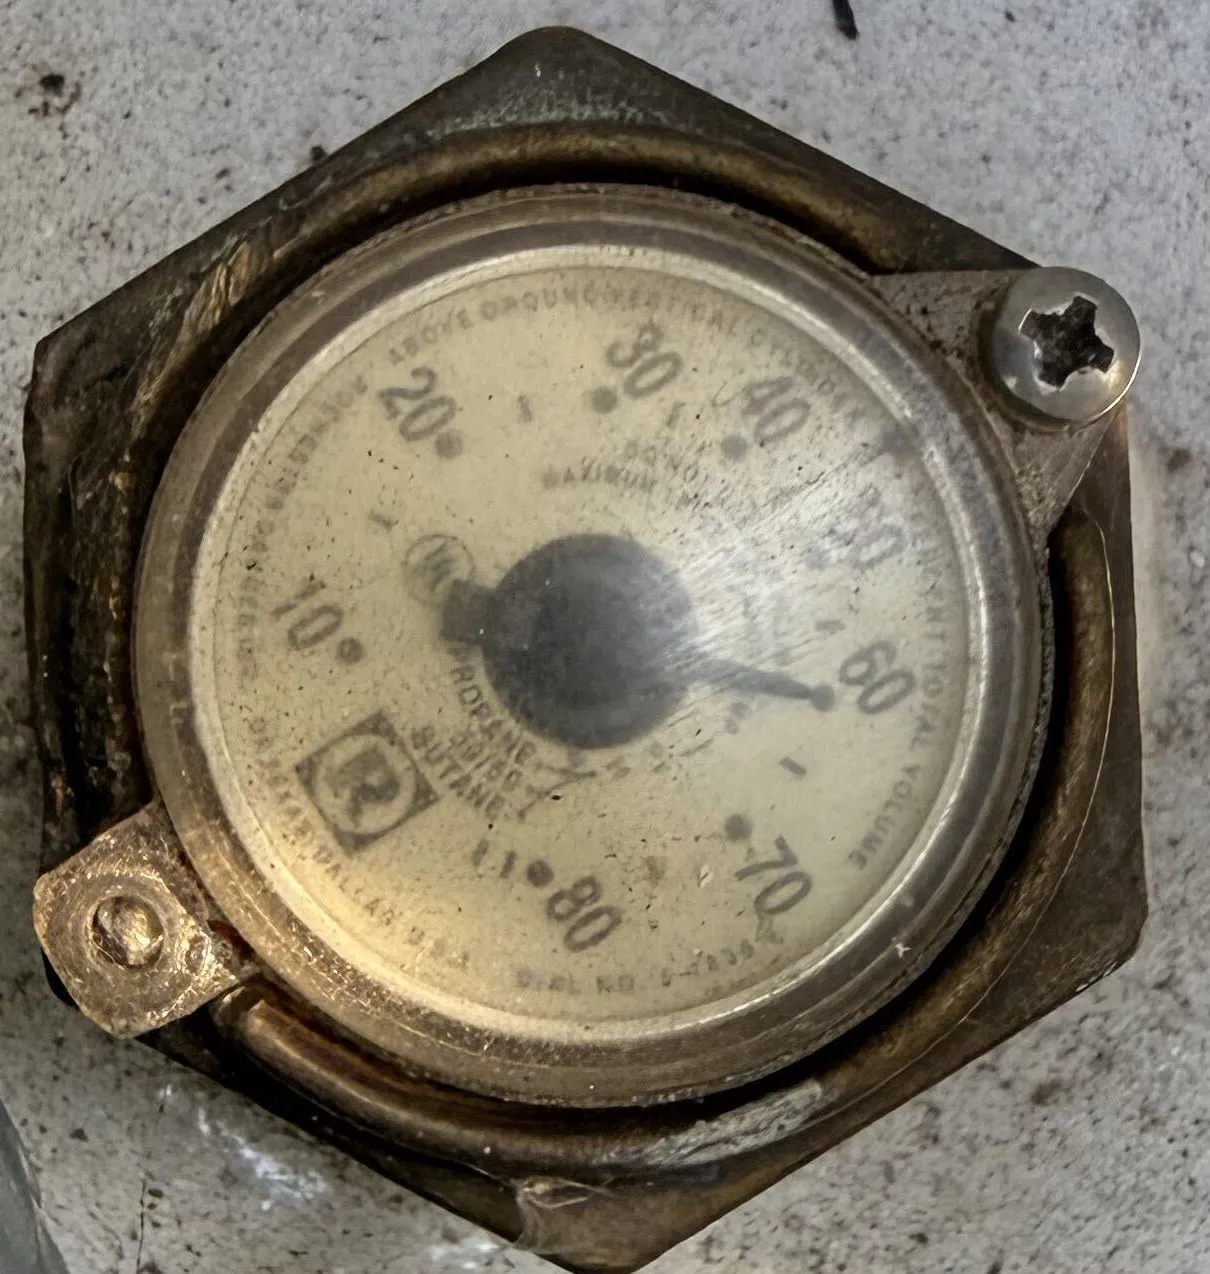
The dial on the propane tank says it’s at 60% and the estimated tank level on the Home Assistant dashboard says it’s at 71%. The monthly meter next to it says we used 95 gallons in September, but it was actually about 2 gallons. All of the numbers come from the lifetime gas counter on the Navien water heater. Fixing them revealed that the water heater is only about a third of the propane leaving the tank.
I built the propane tracker the day after I put the recirculation on a schedule, so I could see how much it affected our gas usage. You can read about how I got the heater into Home Assistant in the first place in Wiring our Navien water heater into Home Assistant and Hot water at the tap with Home Assistant. The Navien ESPHome component exposes a counter of lifetime gas used, in therms. I set up a template sensor sensor.navien_propane_used that multiplies therms by 1.0929 to get propane gallons (a gallon of propane ≈ 91,500 BTU), and marked it total_increasing so Home Assistant treats it as a count-up-only meter. Then I put two utility meters on top of that, one that resets every day and one that resets every month. I set them up with ha-mcp from my own spec.
Since the tank is 120 gallons, that means that each percent on the dial is 1.2 gallons. I start the estimate at the dial reading after delivery (77% when I set it up) and subtract the gallons used since then divided by 1.2 to get back to a percent. The re-anchor script just asks me for the new dial reading after each delivery. I set up an automation to alert me when the estimated amount gets below 35%.
I wanted to include the propane in my Energy dashboard, but the gas source doesn’t accept gallons as a unit (the gas documentation says it accepts cubic feet, CCF, MCF, cubic meters, liters, and energy units). So I created a liters twin sensor.navien_propane_used_l which I use to feed the Energy dashboard (on US units, HA displays cubic feet anyway).
From the beginning, the numbers seemed low. In the first six days, the tracker was running at a rate of about 4.8 gallons per month, the lifetime counter on the heater implied about 2.4 gallons per month, and our average propane deliveries were about 11 gallons per month. So I expected the estimate to be optimistic, but I had no way of knowing how wrong it was.
The phantom 95 gallons
The first thing that went wrong was the counter itself. One evening in early September, it reported unavailable for about seven minutes, followed by a single 0.0, then the real value two seconds later. Unfortunately, my template passed the zero through as a valid value, and the combination of total_increasing and the drop caused a meter reset, so the jump from zero to the real value was interpreted as new consumption. All downstream meters double-counted the heater’s entire lifetime. The gallons sensor jumped by 92.7 gallons in a single hourly long-term-statistics bucket, and the therms counter and liters twin jumped by the equivalent amount in their own units. The 95 gallons the meter showed for September were made up of this phantom 92.7 plus another two or so actual consumption.
An audit of my HA configuration weeks earlier had flagged these templates because I was using | float without a default, which logged a template error every time the heater’s ESPHome device dropped off. The audit noted “don’t fix with float(0) (that registers as a meter reset).. use an availability template and move them to tracked YAML”. I’d written down the fix but hadn’t gotten around to it when the bad zero hit.
The guard and the repair
I approved the fix on two conditions: it had to be tracked YAML, and it had to survive a real restart. The propane templates moved out of UI helpers (which are stored internally in HA and invisible to tracked config) into a template: block in configuration.yaml. Same entity ids, so the statistics stayed continuous, and each has an availability template rejecting non-numeric and values less than or equal to zero.
Why not just use float(0) as a default instead of an availability template? Because the meters don’t ignore 0. I wrote down “0 is exactly the failure; unavailable is ignored.” Utility meters and statistics ignore unavailable values but take 0 at face value, so a default of 0 would turn every dropout into the reset behind the phantom 92.7 gallons.
But the history needed repair, too. utility_meter.calibrate set the monthly meter to 2.33 gallons. Long-term statistics got recorder/adjust_sum_statistics (same operation as Developer tools > Statistics; recorder docs) to remove 92.70 gallons from the gallons counter’s bad hour and 84.81 therms from the therms counter’s. The liters twin was awkward: its statistics are stored in cubic feet even though it reports liters, so adjustment_unit_of_measurement had to match the stored unit, making the correction 12.39 cubic feet. When I restarted the Core that evening, both the guarded templates and the repaired numbers came back as expected.
Only a third of the draw
With the counter clean, the remaining difference between dial and estimate was real. Over the 46 days since the anchor reading, the dial had dropped 17 points (about 20.4 gallons of the 120-gallon tank) and the heater had metered 7.28 gallons. The gas range is on the same tank but unmetered, so the heater was only about a third of the tank’s outflow.
| Tank dial | Heater lifetime counter | |
|---|---|---|
| Anchor after the delivery | 77% | 86.81 gal |
| 46 days later | 60% | 94.09 gal |
| Used | 17 points, about 20.4 gal | 7.28 gal |
The dial is the credible number: 20.4 gallons / 46 days ≈ 13 gallons/month, and it matches the deliveries’ ~11 gallons/month. But the uncorrected estimate was badly late: at the metered rate it would take ~10 months to reach 35%, not the under four the dial was on track to do. The low-tank alert would have fired ~six months after the tank really hit 35%.. no backstop at all.
Now the estimate multiplies the metered gallons by a correction factor input_number.propane_meter_correction_factor = 2.80, so that it reads 60.0% just like the dial. (The factor is the drop in the dial since the anchor, times 1.2 gallons per percent, divided by the gallons the heater metered over the same period.)
To keep the factor honest, I added a new script.propane_log_gauge_reading which stores the dial reading alongside the heater-metered usage since the anchor, and writes a logbook line with the implied factor. It runs whenever I read the dial, and before each delivery. The re-anchor script now also logs the discarded estimate, and the Water Heater dashboard tiles show the latest values. The logbook is purged per recorder retention, so a durable copy of each reading goes into the gauge log table in my notes.
The Grafana Home Assistant telemetry dashboard, which is fed by VictoriaMetrics, has had propane panels since I built the tracker: one for daily use (the one-day increase of the gallons sensor) and one for the tank estimate on a 0-100 scale, with red below 35%. That makes a step down to the dial value easy to spot.
Gotchas
- The Energy dashboard won’t take gallons for a gas source.. a liters twin feeds it, and Home Assistant shows that twin in cubic feet on US units.
- A single
0from the counter looks like a meter reset to atotal_increasingsensor, butunavailableis ignored.. so the guard rejects zeros instead of defaulting to them. - Templates created as UI helpers are invisible to tracked config.. the logic-bearing propane templates live in YAML now.
- Long-term statistics can be stored in a different unit than what the sensor shows, and
adjust_sum_statisticsneeds the stored unit passed explicitly. - After the templates moved to YAML, the Energy dashboard’s helper entity came back with a
_2suffix.. I removed the orphan and renamed the new one back. - A Core restart restored the anchor inputs that same day.. in the logbook it looked like a re-anchor until the history showed identical values before and after.
One pair isn’t enough
I fitted the factor from just one pair of readings, and the range’s share of the tank varies seasonally (cooking is about flat, hot water goes up in winter), so the factor drifts. The estimate is only as good as the latest dial reading, so I’ll read it monthly and before deliveries, and refit the factor when the implied value shifts. One pair fits both a multiplier (2.8x on heater use) and a flat offset (about 0.28 gallons/day for the range), so I need a second pair of readings to tell them apart.